- An average can change when the mix of sales changes; it is not an automatic adjustment to one home’s value.
- Keep measure, geography, property type, period, units and version attached to every comparison.
- Use relevant transactions, scoped condition findings and actual household records alongside the market context.
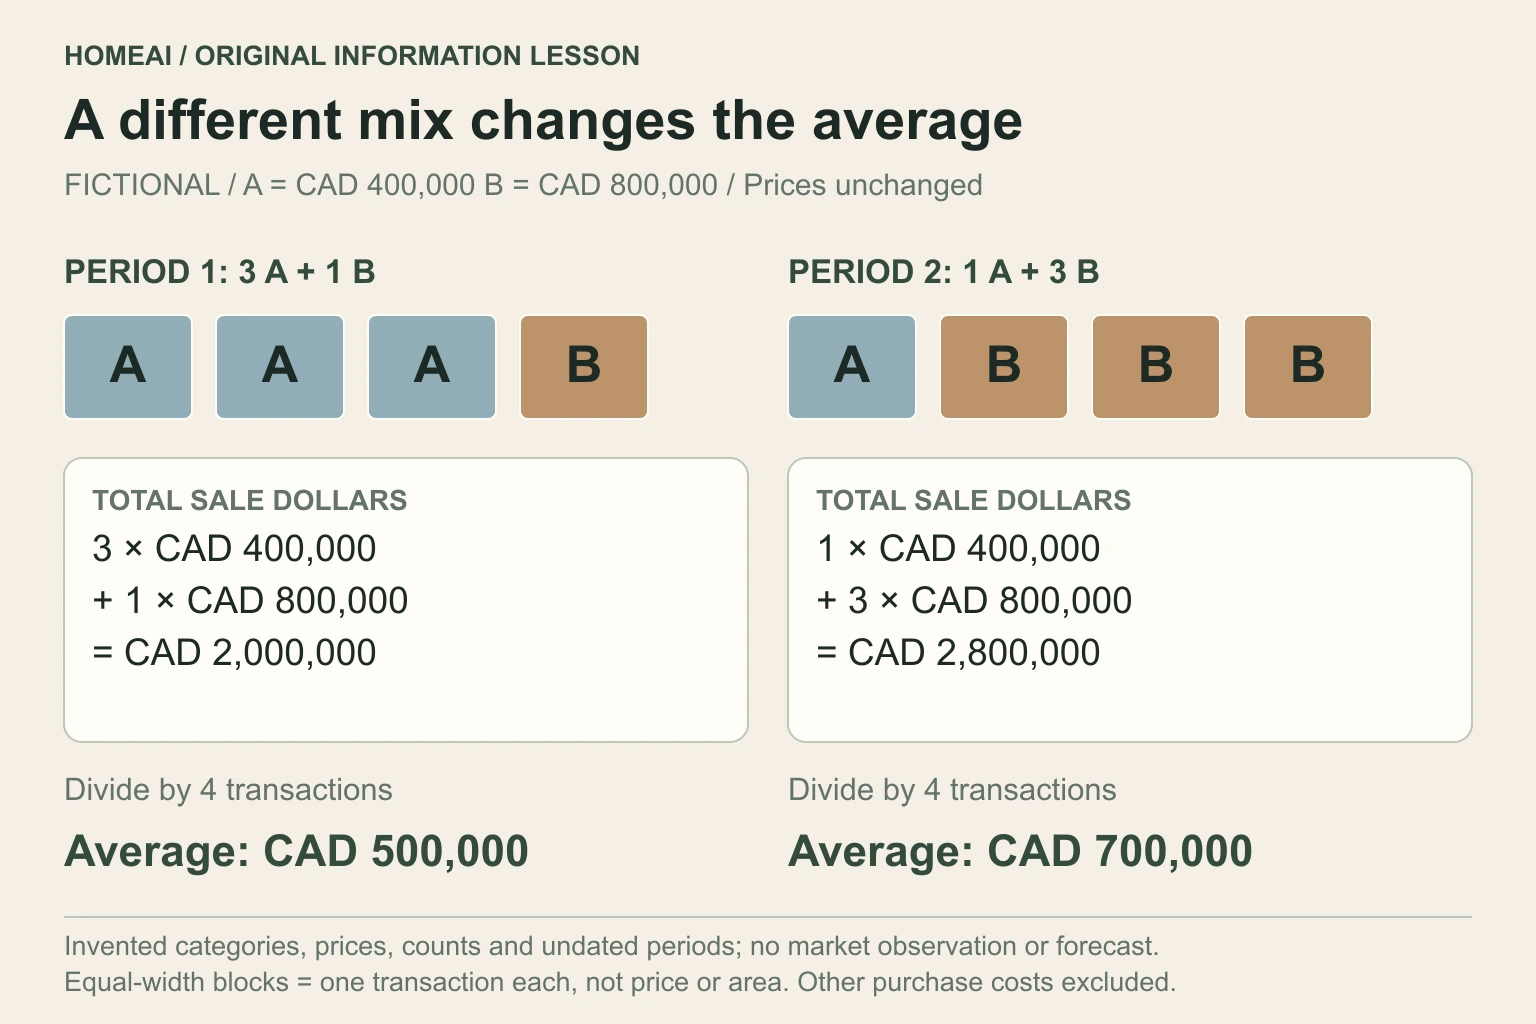
Equal-size transaction blocks show changed counts, unchanged invented category prices and both fully labelled average calculations.
About this illustration
No Canadian market, calendar period, actual transaction, individual value change or forecast is represented. This is a conceptual teaching model, not an assessment of your home.
4 picture lessons appear beside the questions in this guide. Use them to understand the explanation, then consider what it means for your home.
Which question can the headline actually answer?
A housing headline summarizes a defined measure over a defined place and period. It can help you understand market context. Buying or selling one home adds another question: how does this property compare with relevant transactions, and what do its construction, condition, records and ownership commitments mean for the decision?
Before using a number, find its original source and label. Is it an average sale price, a modelled benchmark, an index, sales activity or construction measure? Record the covered geography, property type, reference period, comparison period and publication date. A percentage detached from those details is difficult to interpret.
A source may describe observed transactions or a forecast based on assumptions. Those have different uses. A future year in an outlook is not a completed observation, and a national summary is not a finding about this address. Follow the linked methodology when the distinction matters to your decision.
Keep the market question connected to the actual home without merging them. Ask your realtor for relevant transaction evidence and qualified specialists for unresolved building questions. Confirm actual professional scope and availability. An encouraging headline does not assess a roof, locate a sewer defect or price a particular repair.
Why can the average rise when category prices do not?
An average sale price adds the recorded sale dollars in the included group and divides by the number of sales. Change the mix of lower-priced and higher-priced transactions and the average can change, even if the invented category prices stay the same. CREA’s FAQ explains why sales mix matters.
The original diagram uses fictional CAD arithmetic only. Category A is CAD 400,000 per transaction and category B is CAD 800,000. Period 1 has three A sales and one B sale: CAD 2,000,000 divided by four gives CAD 500,000. Period 2 has one A and three B sales: CAD 2,800,000 divided by four gives CAD 700,000.
Both periods contain four transactions. Neither category price changes; only the counts change. The diagram therefore illustrates an average moving without a category-price increase. It represents no Canadian city, date, actual sale or forecast. It cannot tell you what happened to the value of any individual home.
A median is the middle sale value in an ordered set, using the average of the two middle values when necessary. It also belongs to the included group. Ask what was sold and which locations or property types contributed, rather than treating an average or median change as an automatic adjustment to a listing price.
The same category prices can produce a different average
Equal-size transaction blocks show changed counts, unchanged invented category prices and both fully labelled average calculations.
Numbers identify the parts explained below.
- Same invented prices
A remains CAD 400,000; B remains CAD 800,000 in both teaching periods.
- Different sales mix
Period 1 contains 3 A and 1 B; Period 2 contains 1 A and 3 B.
- Same denominator
Both groups contain exactly 4 transactions; the average divides total sale dollars by 4.
- Different averages
CAD 2,000,000 ÷ 4 = CAD 500,000; CAD 2,800,000 ÷ 4 = CAD 700,000.
What does this illustration leave out?
No Canadian market, calendar period, actual transaction, individual value change or forecast is represented. All prices, categories, counts and periods are invented. Block width represents one transaction, not price or floor area; no taxes or other costs are included.
Did the average change because comparable prices changed, because the sales mix changed, or both?
Explore this with HomeAI ↗Opens an editable question. Nothing is sent until you choose to send it.The same category prices can produce a different average
Every figure in this example is fictional. Category A and B prices stay fixed; each period has four transactions. Only the counts change.
| Entry | Period 1 | Period 2 |
|---|---|---|
| Category A price | CAD 400,000 | CAD 400,000 |
| Category A count | 3 transactions | 1 transaction |
| Category B price | CAD 800,000 | CAD 800,000 |
| Category B count | 1 transaction | 3 transactions |
| Total sale dollars | (3 × CAD 400,000) + (1 × CAD 800,000) = CAD 2,000,000 | (1 × CAD 400,000) + (3 × CAD 800,000) = CAD 2,800,000 |
| Total count | 4 transactions | 4 transactions |
| Average | CAD 2,000,000 ÷ 4 = CAD 500,000 | CAD 2,800,000 ÷ 4 = CAD 700,000 |
The average changes because the share of the invented higher-priced category changes. This isolates sales mix; it does not show that either category price or an individual home’s value increased. The equal-width blocks count transactions and do not encode price, area or quality.
Invented arithmetic only, prepared and reviewed October 5, 2026. No actual market, city, property, date, trend, forecast or transaction is represented. Taxes, fees, financing and other costs are excluded. CREA’s FAQ supports the average and sales-mix concepts, not these invented amounts.
What does a benchmark add, and what remains outside it?
CREA’s MLS Home Price Index models prices while accounting for recorded property characteristics and geography within its coverage. Its benchmark represents a typical property for a supported area and category. This helps answer a different question from the simple average of whichever homes sold during one period.
Keep the published benchmark’s area, property category and characteristic description attached. The retained methodology explains how those attributes are used in the model and how supported categories differ across subareas. A modelled typical property is not an inspected home offered for sale or an appraisal of this address.
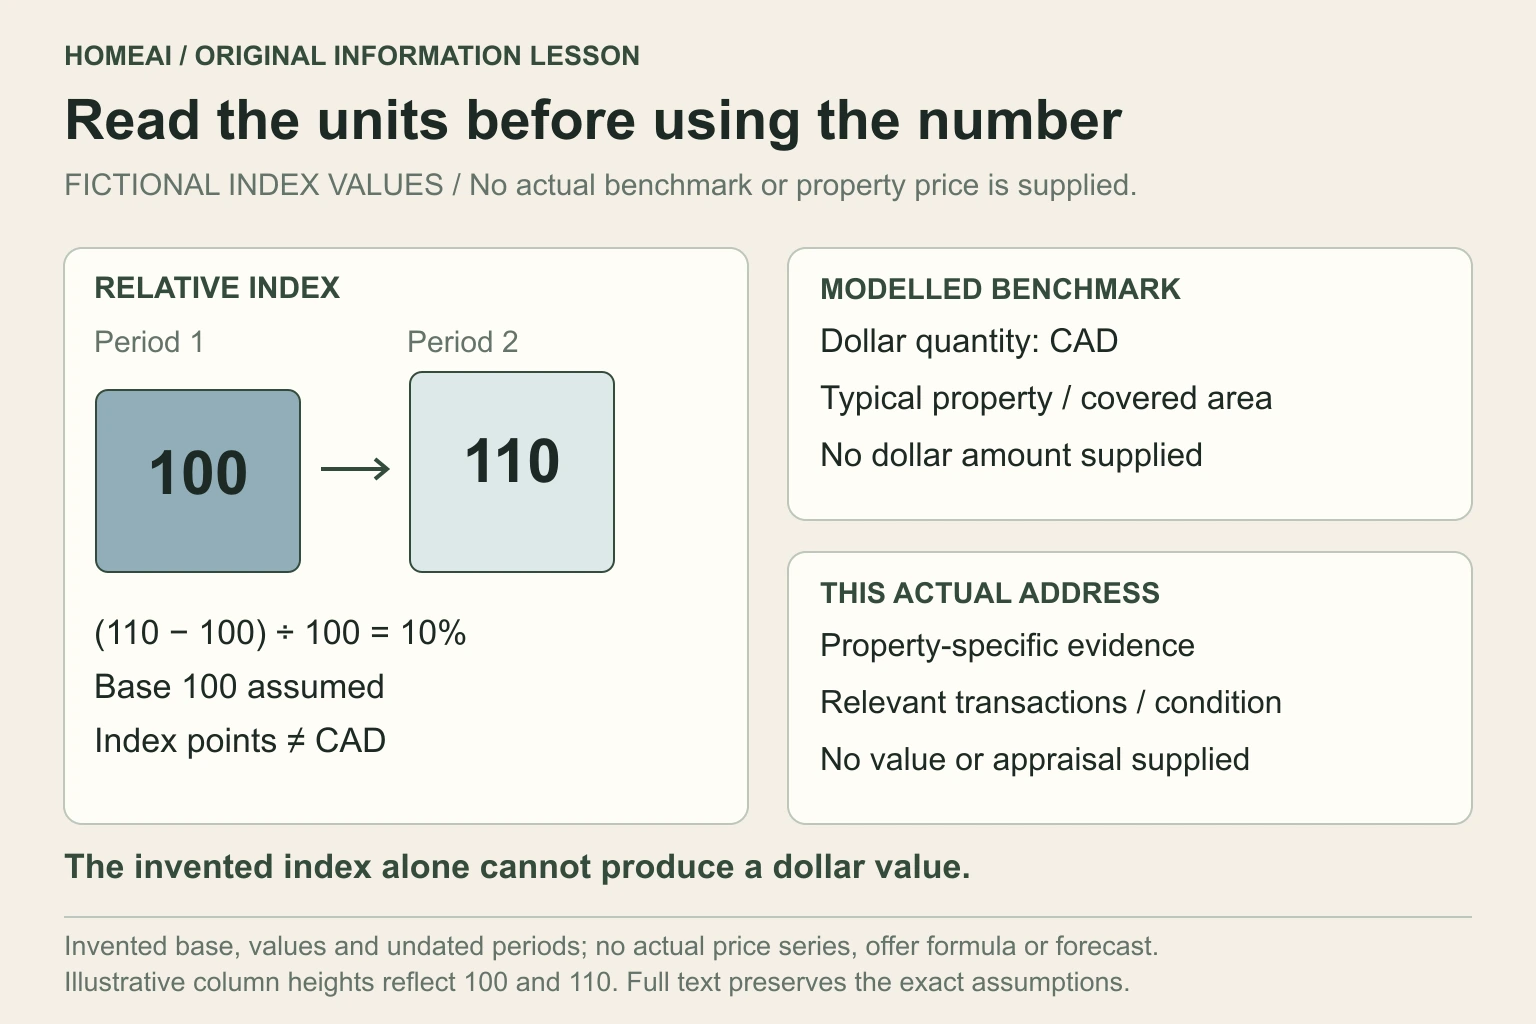
An index expresses relative price movement against its stated reference base; a benchmark price is expressed in dollars. Those units are different. The second diagram uses an invented index base of 100 and later value of 110 to show a 10% relative change. It supplies no dollar benchmark and cannot produce a property value from those numbers alone.
Read the current model notes and coverage rather than assuming every community or category has the same series. An index percentage is not a diagnosis of hidden condition, an automatic offer formula or evidence that each nearby house changed equally. Keep an address-specific valuation question with the appropriately scoped professional evidence.
An index, a benchmark and this address answer different questions
A labelled relative index calculation and separate unit-and-purpose categories for index, modelled benchmark price and an actual address assessment.
Numbers identify the parts explained below.
- Relative index
Fictional base 100 and later 110 yield (110 − 100) ÷ 100 = 10% relative change.
- Dollar benchmark
A published benchmark price uses dollars and a modelled typical property for its supported area and category.
- Actual address
A property-specific value question needs its own relevant evidence and appropriate professional scope.
- Keep the units
An index level is not CAD. No dollar benchmark or address value can be calculated from this illustration.
What does this illustration leave out?
No actual index series, dollar benchmark, property price, appraisal, condition finding or conversion between the categories is established. The index base, values and teaching periods are invented; the 10% arithmetic is exact for them. No actual price series, dollar conversion, offer formula or forecast is supplied.
Am I reading a relative index, a dollar benchmark, or evidence about this particular home?
Explore this with HomeAI ↗Opens an editable question. Nothing is sent until you choose to send it.An index, a benchmark and this address answer different questions
An index reports relative movement. A benchmark price reports a modelled typical property in dollars. An actual address has a separate valuation question.
- Fictional index quantity
- Teaching Period 1 has index 100 and Period 2 has index 110. The base is 100 by assumption. Both values and periods are invented; no calendar date or actual index is supplied.
- Exact relative calculation
- (110 − 100) ÷ 100 = 0.10 = 10%. This is a relative change in the fictional index. Index points are not CAD.
- Published benchmark-price quantity
- Use the actual publisher’s CAD benchmark, supported geographic area, property category and modelled attributes. This figure deliberately supplies no benchmark dollar amount.
- Actual address question
- Relevant transactions and appropriately scoped professional evidence address this home’s value and condition. A modelled typical property is not this listing.
- No conversion or offer formula
- There is no dollar benchmark or address value to calculate from the invented 100 and 110 alone. The figure supplies no listing adjustment, appraisal or forecast.
The index example is invented arithmetic prepared and reviewed October 5, 2026. CREA’s retained July 2023 methodology and 2025 annual-review FAQ explain actual model, units and coverage concepts; their dated examples do not set a current national review deadline or value this property.
Read the quantity before comparing the number
- Average sale priceIncluded sale dollars divided by included sale count. The group’s mix matters.
- Median sale priceThe middle value in the ordered sales group, with the two-middle-value convention when needed. It still belongs to that group.
- HPI benchmark priceModelled typical-property price for a supported area and category, expressed in dollars.
- Price indexRelative movement against a stated base. Preserve its units and do not turn it into an address-specific dollar value.
Why must place and property type stay attached to the number?
A national aggregate, a real estate board’s territory and a municipality can cover different groups of transactions. A condominium apartment series and a detached-home series also describe different categories. Two numbers called local prices may answer different questions if their coverage is not the same.
Write the actual geographic label and property definition from the original table. Ask whether the territory includes the neighbourhood and type you are considering. CREA’s methodology describes geographic groupings and supported categories; the annual-review FAQ explains that sparse sales can limit coverage.
An unavailable small-area series is a data limit. It does not establish that prices stayed unchanged, nor justify replacing the missing information with a national percentage. Ask what relevant local transaction evidence is available and how its size, period and comparability limit the answer.
When two charts seem to disagree, compare their measures, areas and categories before choosing one. Both may describe their own groups correctly. The particular property still needs comparison on actual features and condition; a broad boundary label cannot supply the details left out of a sale record.
How do the comparison period and seasonal adjustment change the story?
A month-to-month comparison asks how the measure changed from the previous month. A year-over-year comparison asks how it changed from the same month a year earlier. Both can be useful, but they use different starting points. Copy the actual comparison period instead of interpreting every percentage as a recent monthly change.
Seasonal adjustment removes estimated recurring seasonal and calendar effects to help comparisons across periods. Statistics Canada explains that adjusted data still include irregular movements. Adjustment does not reveal a pure trend, remove every unusual event or forecast the next month.
Read whether the specific series is adjusted, unadjusted or expressed as an annualized rate. Do not apply a general seasonal-adjustment explanation to every housing measure. The reviewed August 2026 New Housing Price Index release explicitly says that its data are not seasonally adjusted.
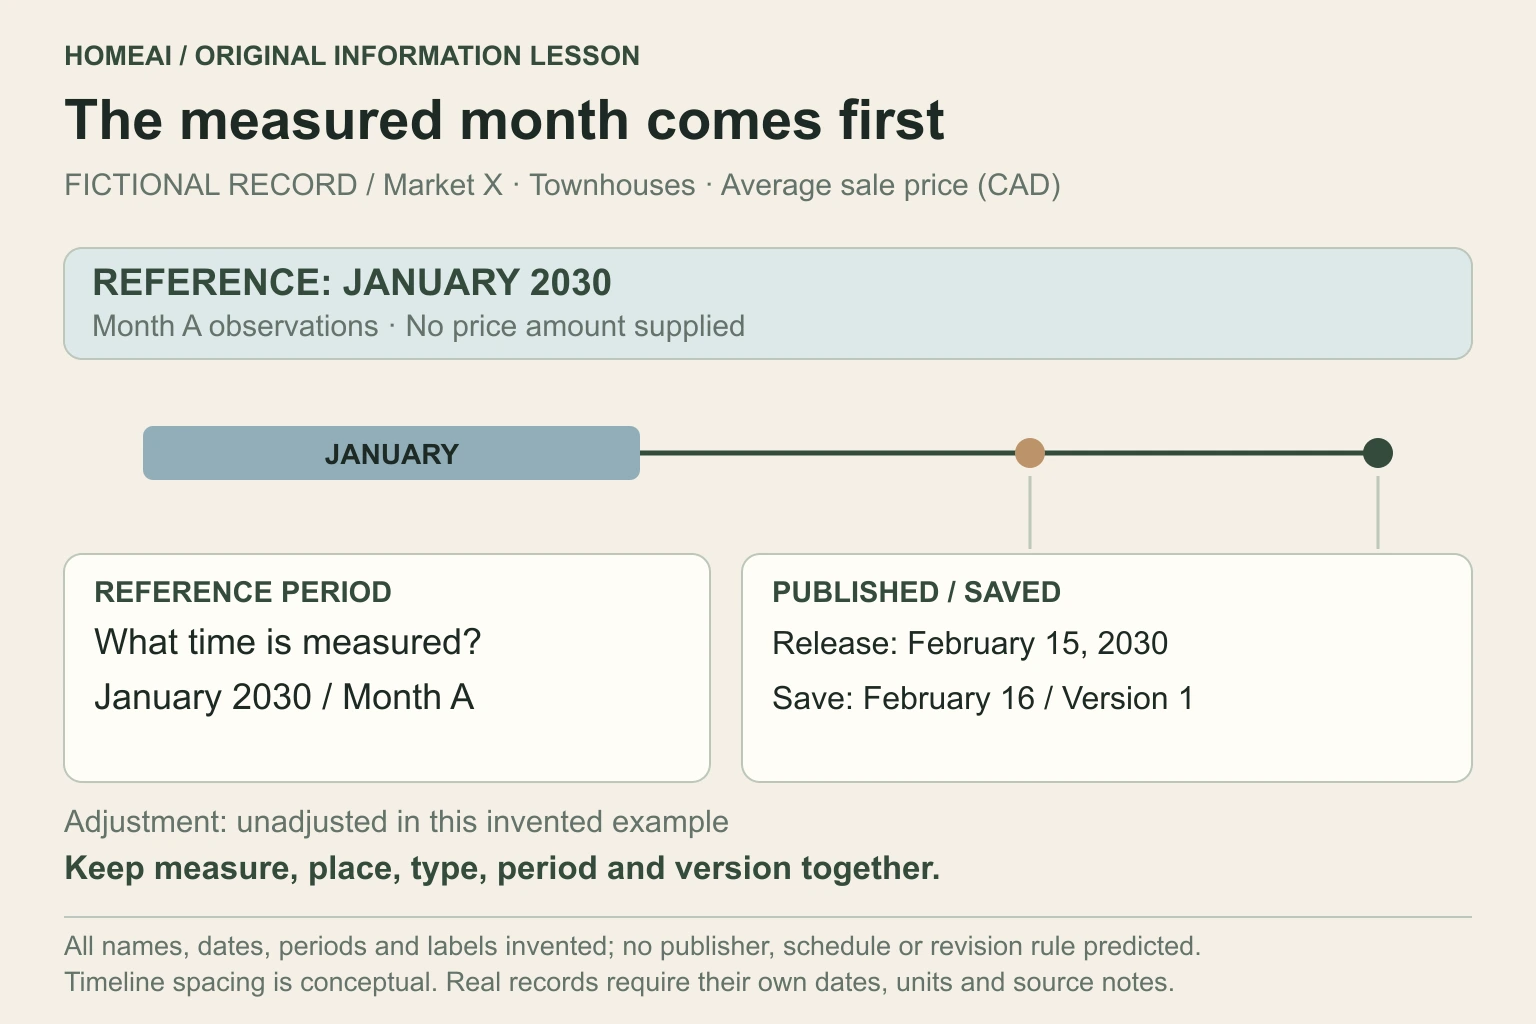
Publication date is also different from reference period. A September release can describe August observations. The original record-reading diagram uses a completely fictional release example to keep the measure, place, type, reference month, release date and version together. Its dates and adjustment label are invented, not a real publisher’s release schedule.
The measured month is different from the release date
A fictional reference-month interval followed by publication and saved-version points, with measure, place, type and adjustment labels attached.
Numbers identify the parts explained below.
- Reference period
The observations describe invented January 2030, labelled Month A.
- Publication date
The invented release happens on February 15, 2030; that does not make the observations February data.
- Saved version
The fictional reader saves Version 1 on February 16, 2030, retaining labels for later comparison.
- Measure and coverage
Invented Market X, townhouse average sale price, unadjusted; no numerical market value is supplied.
What does this illustration leave out?
No actual publisher, market, statistic, release schedule, revision policy, current observation or prediction is represented. All market names, dates, periods and labels in this figure are invented. Timeline spacing is conceptual, not elapsed-time scale; use the real publisher’s dates and policies for an actual record.
Which time does the number describe, and which version am I comparing?
Explore this with HomeAI ↗Opens an editable question. Nothing is sent until you choose to send it.The measured month is different from the release date
This complete record is invented to show which labels belong with a housing statistic. It supplies no numerical market value or actual release schedule.
- Measure and units
- Fictional townhouse average sale price, expressed in CAD. No price amount is supplied.
- Geography and type
- Invented Market X; townhouse transactions only. This label names no real city, board or publisher.
- Reference period
- Month A: January 2030. That is the invented interval the observations describe.
- Publication date
- February 15, 2030. A later publication date does not make the reference observations February data.
- Adjustment
- Unadjusted in this fictional example only. Read the real series’ own adjustment label rather than assuming every housing measure is adjusted.
- Saved version and access date
- Version 1, saved February 16, 2030. Keep the original table, notes and date so any later version can be reconciled.
- Comparison period
- Choose and label the actual starting period before calculating a comparison. This figure provides no second observed period or percentage change.
All names, dates, labels and periods are invented, prepared and reviewed October 5, 2026. Timeline spacing is conceptual. It predicts no release, revision or future market observation. Current Canadian releases and the particular publisher’s methodology determine real dates, adjustment and revision rules.
Why can a saved historical series later look different?
Some series revise earlier values when new information or model updates become available. Statistics Canada’s seasonal-adjustment guide explains that additional observations can change estimated seasonal patterns. CREA’s annual-review material explains that benchmark attributes and historical HPI series can change during its review process.
That does not mean every housing series is revised in the same way. The reviewed August 2026 New Housing Price Index release says its data are not subject to revision. Read the particular series’ own policy. Keep a publisher’s dated methodology alongside the figures instead of borrowing a rule from a different dataset.
Save the original file or table, access date, reference period, units, adjustment label and stated version. If a later download differs, compare the publisher’s notes and versions before treating it as an error. A cropped screenshot without its labels makes that reconciliation harder.
The retained CREA methodology is the July 2023 file and the linked annual-review FAQ is the 2025 file. They explain model and revision concepts; this guide does not turn an older review-month example into a current deadline. Use the actual current release and explanatory notes for your dated comparison.
Do new-home prices or housing starts tell me a home is ready?
Statistics Canada’s New Housing Price Index measures changes in specified new-house selling prices at the contract stage, accounting for quality characteristics. Its reviewed note names single houses, semi-detached houses and townhouses in its covered census metropolitan areas. It does not describe every new apartment or the resale price of this home.
A contract-stage price measure cannot establish workmanship, completed deficiencies or what your particular purchase includes. Read the actual contract and matched specifications with the appropriate advisors. Obtain the records and qualified inspection needed for the building question instead of using the index as a readiness check.
CMHC’s Starts and Completions Survey defines construction stages for its statistical purposes. A counted start and a counted completion answer construction-data questions. They do not replace the builder’s handover, applicable authority documents or a scoped assessment of the home you intend to occupy.
A seasonally adjusted annual rate expresses an adjusted construction pace on an annual basis. It is not simply the number of homes completed during that one month. Keep units and the survey definition attached; the construction-stage and new-build inspection guides explain the separate property evidence to request.
How should I connect the story to comparable property evidence?
Ask your realtor which actual transactions are relevant to this home and why. Keep their dates, transaction status, location, property form and material features together. An asking price describes what a seller requested; a recorded sale describes a different event. Confirm what each supplied record actually establishes.
Compare the known construction, layout, service arrangements and changes before treating two homes as equivalent. Record when an important feature or condition is unknown. A small set of nearby sales can inform a comparison without proving the subject home has the same condition or that every apparent difference has a fixed dollar adjustment.
Ask qualified specialists to resolve consequential technical questions and define any proposed work. A roof access limit leaves a roof-assessment question; it does not establish a failed roof or an automatic discount. A contractor quotation prices its stated scope, while an appraisal has its own valuation purpose and limits.
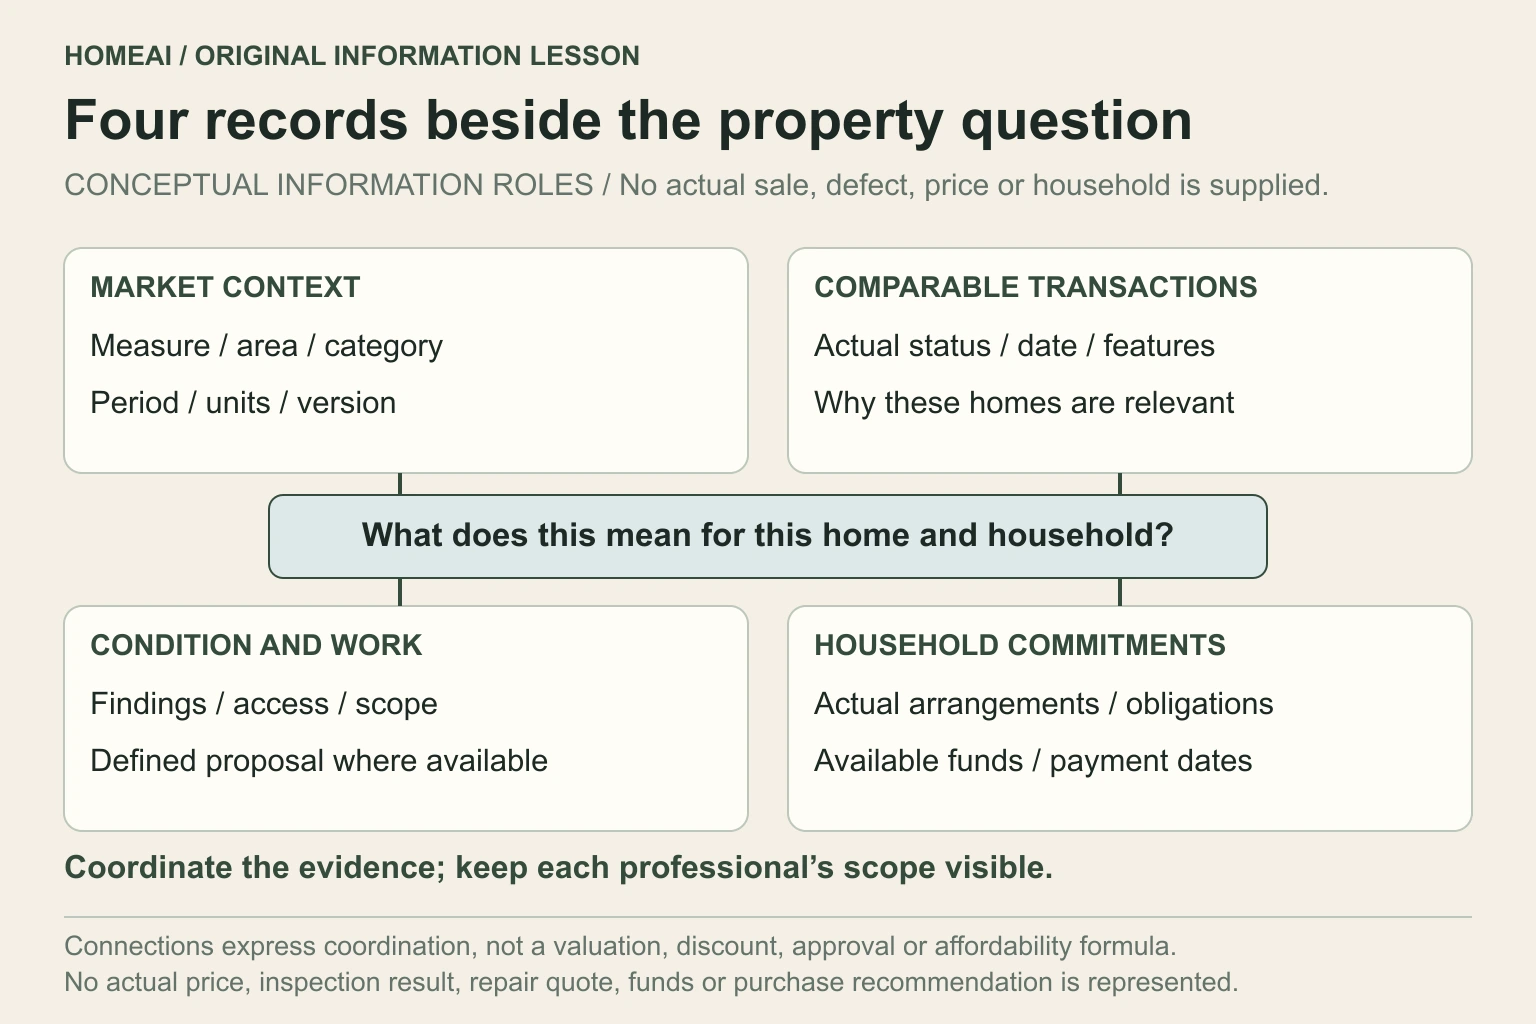
The four-role diagram keeps market context, comparable transactions, condition findings and household commitments side by side. Your technical, transaction and financial advisors connect the appropriate evidence to the actual decision. No one record completes all four jobs, and HomeAI cannot turn a headline into a certified property value.
Put four kinds of evidence beside the buying question
Four distinct record roles and a central question: what does this evidence mean for this home and household?
Numbers identify the parts explained below.
- Market context
Keep measure, area, category, period, units, adjustment and version.
- Comparable transactions
Confirm actual status, date, location and features; an asking price and a recorded sale are different records.
- Condition and work
Retain the finding, access limits, specialist scope and defined quotation where available.
- Household commitments
Use actual arrangements, obligations, available funds and payment dates with appropriate advice.
What does this illustration leave out?
No actual sale, diagnosis, quotation, price adjustment, available funds, affordability decision or purchase recommendation is shown. Conceptual evidence-role diagram. Links express coordination, not a numerical valuation, approval or guaranteed purchase outcome.
Which part of the decision is supported, and which question still needs a different record?
Explore this with HomeAI ↗Opens an editable question. Nothing is sent until you choose to send it.Put four kinds of evidence beside the buying question
A clear buying or selling file keeps these jobs connected while preserving each record’s scope. The central question is what is supported for this home and household, and what still needs answering.
- Market context
- Retain the original measure, geographic coverage, type, reference period, comparison, units, adjustment and version. A headline describes that record, not an inspected home.
- Comparable transactions
- Confirm actual transaction status, date, location and material features. An asking price and a recorded sale describe different events. Ask why the selected homes are relevant and which differences remain uncertain.
- Condition and proposed work
- Keep complete findings, access limits and specialist scope. A quotation prices a defined task; an inaccessible area leaves an unanswered condition question rather than proving the worst case.
- Household commitments
- Use actual financing, insurance, service arrangements, other obligations, available funds and due dates. Broad affordability context does not replace personal records or appropriate advice.
- Coordinated decision
- The realtor, appropriately qualified technical professionals and transaction/financial advisors explain their own roles and limits. Confirm training, licensing, scope and availability where relevant.
The links express coordination, not a valuation equation. This figure contains no actual sale, defect, discount, quoted repair, household funds, approval, personal financial recommendation or guaranteed purchase outcome.
Use each record for the question it can answer
- Market recordMeasure, geography, property category, reference period, adjustment and version give market context.
- Comparable transactionActual status, date, location and features support a limited property comparison.
- Condition and work recordA scoped finding, access limit or quotation answers its stated technical or work question.
- Household recordActual commitments, available funds, arrangements and due dates inform personal planning with the appropriate advisor.
Can an affordability story decide what this household can carry?
A national affordability discussion explains a broader issue. Your decision depends on this household’s commitments, the actual financing and insurance arrangements, and this home’s ongoing costs and defined work. Those amounts and payment dates need their own records; they do not appear in a market-price percentage.
The Bank of Canada’s October 1, 2026 remarks discuss how large shelter commitments can leave households less room for spending, saving and unexpected expenses. That is dated economic context. This guide uses no rate forecast, price target or personal borrowing recommendation from the speech.
Use the first-year ownership budget guide to separate purchase cash, recurring payments, planned work and unresolved allowances. Ask the appropriate lender, insurer and financial or transaction advisor about actual arrangements and unanswered questions. A lower broad-market measure does not settle repair costs, accessible savings or whether the household can afford this home.
Avoid using a forecast as a guaranteed future funding source. If a decision depends on selling later for an assumed amount or receiving a particular future rate, keep that assumption visible and seek appropriate advice. A forecast’s published range and assumptions do not make an individual household outcome certain.
What would the evidence ladder look like in a fictional purchase?
Fictional buyer Noor likes a townhouse after reading a national headline. The realtor supplies two reported local transactions. One property is a different form, and the subject home’s inspection records restricted roof access. No actual prices, defect findings or repair quotations are supplied in this learning example.
Noor first records the headline’s original measure, geography and reference period. She then asks what the supplied transaction records establish and how their property forms and features compare. The broad-market record gives context while the local records support a separate, limited comparison.
She keeps the roof question open and requests appropriate further scope rather than calling the roof failed or assigning an invented discount. She asks about available repair proposals only if findings justify a defined task. Her actual household plan remains another record, with its own commitments and payment dates.
The fictional ladder leads to better questions and actual transaction advice, not an automatic purchase recommendation. It establishes no property value, concealed defect, affordable budget, future appreciation or inspection result. A seller can use the same separation to explain which evidence supports a claim and which question remains unresolved.
How do I keep a Canadian market-reading record current?
Start with the original Canadian publisher and preserve the exact table or release. Record when you accessed it, what period it measures and whether it is observed data or a forecast. Keep later versions separate so you can explain what changed instead of silently mixing old and new figures.
At the October 5, 2026 review, the retained CREA release describes August 2026 and was published September 15. The retained New Housing Price Index release also describes August and was published September 17. Those are dated reading examples; neither supplies October transaction observations or an address-specific current price.
CMHC’s retained Housing Market Outlook 2026 was published February 10 and states an information cutoff of January 15, 2026. Its future-year projections remain forecasts prepared from that information. The current webpage was read in full, but this guide imports no forecast prices, rates or regional outcomes.
Refresh the appropriate property evidence too: relevant transactions, actual inspection or specialist scope, complete work proposals and household arrangements. Preserve the Canadian area and source limits when comparing them. HomeAI can explain the measures and organize the questions; the actual qualified advisors address valuation, condition, purchase terms and personal finances.
Practice the distinction.
One headline, four different questions
Fictional buyer Noor has a national headline, two reported local transactions and a townhouse inspection with restricted roof access. The example supplies no actual price, defect finding or repair quotation.
Reported observations
- The headline has its own measure, geography and reference period.
- One supplied transaction concerns a different property form.
- Restricted roof access leaves an assessment question rather than proving a failed roof.
Compare the explanations
Expand each possibility to see the evidence needed to distinguish it. Similar symptoms can have different mechanisms.
The market comparison needs closer matching
The headline and reported transactions may describe groups or properties unlike the townhouse.
Original measure labels and relevant dated transaction records with comparable features.
Condition and household planning remain separate
Market context leaves the actual roof and ownership commitments unanswered.
Appropriate technical scope and current household, financing and service records.
A useful next question
Noor asks the realtor to explain the transaction comparison, requests suitable roof-assessment scope and keeps the actual household plan beside the property evidence.
No value, hidden defect, automatic discount, personal affordability conclusion, future price or inspection result is represented.
Know what the words mean.
- Sales mix
- Which properties contributed to the sales group. A changed mix can move its average even when invented category prices remain unchanged.
- MLS® HPI benchmark property
- A modelled typical property for a supported area and category. It is not an inspected listing or a valuation of this address.
- Reference period
- The time described by the observations. It can be earlier than the publication date.
- Seasonally adjusted annual rate
- An adjusted pace expressed on an annual basis, rather than the raw number occurring during one month.
- Data version
- The particular downloaded or published record, with its date and notes, retained so later changes can be reconciled.
Questions to bring
to the conversation.
- What measure, area and property type does the original number describe?
- What period, comparison, adjustment, units and version belong to it?
- Which actual transactions are comparable, and what condition questions remain unanswered?
- What do this household’s actual arrangements, obligations and payment dates require?
Separate a showing observation, an existing record and a new professional assessment. Unknown means a question remains; it does not automatically mean a defect.
Use the evidence planner ↗Go to the source.
Original HomeAI explanation informed by these public references. Sources support the underlying guidance; they have not reviewed or endorsed HomeAI. Diagrams are conceptual, and calculator outputs depend on your inputs.
Concepts reviewed for this refresh on October 5, 2026. CREA, Statistics Canada and CMHC measures have their own definitions, geography and reference periods. Retained 2026 releases and outlooks remain dated context, not predictions. Every CAD amount, index value and date shown in the teaching figures is explicitly fictional; no figure values a particular home or establishes affordability.
Publication & source review
First published .
Sources reviewed .
- CREA · average, median and geographic sales mix
Where this reference applies
Jurisdiction: Canada; participating real estate boards and associations
Source reviewed: 2026-10-03
Aggregate versus unit statistics, residential dollar volume divided by sales, median definition and high-priced-area sales mix. No property appraisal.
- CREA · what the MLS® Home Price Index measures
Where this reference applies
Jurisdiction: Canadian markets covered by the MLS® HPI
Source reviewed: 2026-10-03
Modelled typical-home attributes and comparison through time; coverage is qualified by current methodology and available local series.
- CREA · currently linked MLS® HPI methodology
Where this reference applies
Jurisdiction: Participating Canadian boards, market segments and property categories
Source reviewed: 2026-10-03
Printed pages 4–8 and 12–15: index/base period, benchmark attributes, geography, modelled observations, aggregation, annual maintenance and informational limits. No current review-month deadline imported.
- CREA · currently linked MLS® HPI annual-review FAQ
Where this reference applies
Jurisdiction: Canadian MLS® HPI covered markets and benchmark series
Source reviewed: 2026-10-03
Both pages: coverage and benchmark/historical-series changes, sparse areas, updated data. Does not turn a benchmark into an address-specific value.
- CREA · September 15, 2026 release for August 2026
Where this reference applies
Jurisdiction: National and major Canadian MLS® market statistics; all housing types in the release
Source reviewed: 2026-10-03
Actual release date/reference month and cautions about divergent neighbourhoods/geographic differences. Moving homepage; retained dated body is the evidence for this review. No rate forecast or market-timing advice.
- Statistics Canada · seasonal adjustment concepts, 2026
Where this reference applies
Jurisdiction: Canadian statistical time-series interpretation; general methods, not a house price series
Source reviewed: 2026-10-03
Sections 1.2, 1.6, 1.8–1.10 and 2.1–2.7: regular calendar effects, irregular movement, revision and comparison context. No claim that every housing series is seasonally adjusted.
- Statistics Canada · August 2026 new-house price index scope
Where this reference applies
Jurisdiction: Canada, provinces and 27 census metropolitan areas; stated new-house types
Source reviewed: 2026-10-03
Complete Note to readers: contract-stage prices, consecutive-period specifications, listed dwelling types, no seasonal adjustment and no value-added taxes in collected builder prices. No single-address defect, tax or new-condo price conclusion.
- CMHC · starts, completions and absorption survey methodology
Where this reference applies
Jurisdiction: Canadian survey coverage and defined construction/intended-market categories
Source reviewed: 2026-10-03
Complete methodology body: distinct construction stages, rental/ownership intended markets and annualised seasonal rate. A statistical completion is not a home quality/possession/warranty clearance.
- CMHC · 2026 outlook and information cutoff
Where this reference applies
Jurisdiction: National/regional and named CMA forecasts in the 2026 report
Source reviewed: 2026-10-03
Captured full page; read the report title, date, forecast labels and stated cutoff. No regional forecast amount, current market direction or property outcome is adopted.
- Bank of Canada · Canada’s housing affordability dilemma
Have a question about your home?
Start with the symptom, timing and what you have observed.
Ask HomeAI